")
")
")
")
")


 The Bitcoin Hash Ribbons indicator emerged in 2019 with the publication of the article "Hash Ribbons & Bitcoin Bottoms" on Medium. The author, Charles Edwards, claims that moments when Bitcoin miners capitulate, i.e., start selling their accumulated Bitcoin or mining equipment, or even shut down their businesses, are the best entry points for buying Bitcoin or mining equipment. At present, the indicator is showing such a moment, with the lines being drawn in red. Let's delve deeper into this indicator.
The Bitcoin Hash Ribbons indicator analyzes the Bitcoin network's hashrate and constructs Displaced Moving Averages (DMA), which are derived from the financial market and its mathematical analysis. In short, DMA shows the trend or changes in price, or in this case, the hashrate on the Bitcoin network.
The analysis involves two lines: a 30-day moving average (30DMA) and a 60-day moving average (60DMA).
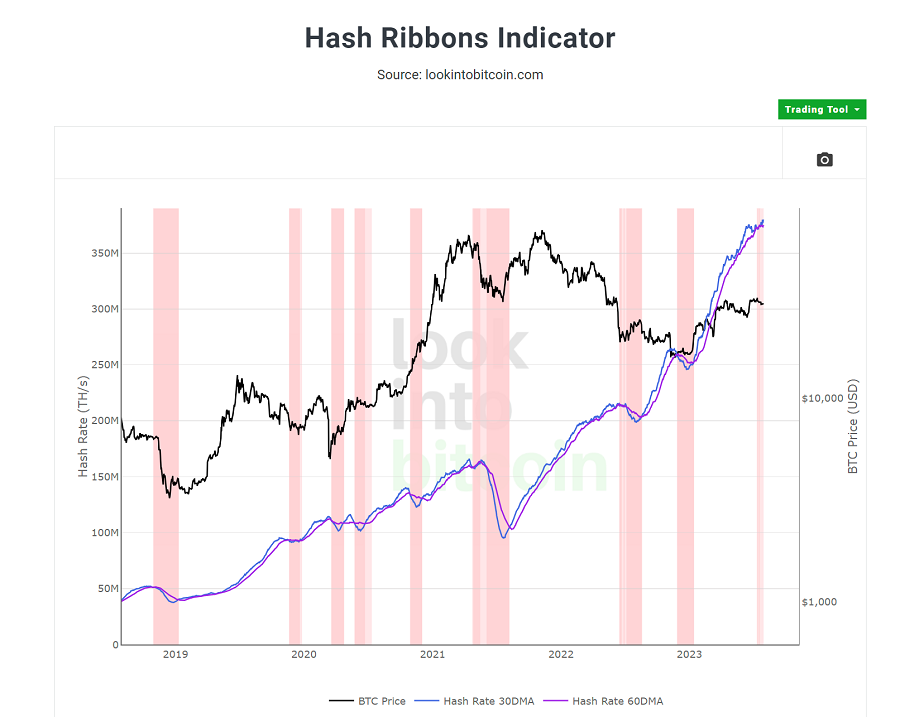
Understanding the Bitcoin Hash Ribbons chart:
Miner capitulation in Bitcoin: 30DMA falls below 60DMA, indicating a decrease in hashrate. This is represented by dark pink vertical lines.
End of miner capitulation: 30DMA returns above 60DMA. This is represented by light pink vertical lines.
Bitcoin buy signal: 30DMA returns above 60DMA, coinciding with a rise in BTC price. This is represented by white color.
The transition from the red line to the white line indicates the possibility of the beginning of a long-term upward trend in Bitcoin and a potential entry point for long-term investment in the first cryptocurrency.
According to the author's words in the 2019 article about the BTC Hash Ribbons indicator, it only failed once in January 2015, and in all other cases, it accurately predicted the overall upward trend in BTC price.
However, looking at modern data from 2019 to 2023, there was another such instance in mid-2022 when the Bitcoin price decreased contrary to the forecast.
Thus, the Bitcoin Hash Ribbons indicator can be considered quite accurate, with the author claiming an accuracy rate of approximately 90%. In 90% of cases, buying BTC during miner capitulation or just after it proves to be profitable.
Moreover, the minimum Bitcoin price usually occurs during the midpoint of the miner capitulation cycle (in the middle of the red lines).
You can track the Bitcoin Hash Ribbons indicator on the website Lookintobitcoin.com or set up the chart yourself on TredingView.com.
This article's sole purpose is to provide information about the tools used by crypto investors and is not financial advice. Whether to follow this indicator or not is entirely at your discretion.