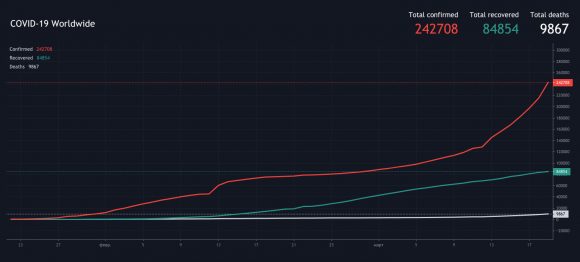
 TradingView - This is one of the most used graphical platforms worldwide for traders and investors, which, by the way, is used not only by crypto traders, as many might think. Recently, on a TradingView platform, a graph of the impact of the coronavirus COVID-19 on a global scale has been added. In response to the ongoing global health crisis, affecting millions of people around the world in more than 150 countries, the new COVID-19 charts provide an overview of the magnitude of the current pandemic through visualization of data collected by the Center for Systems Science and Engineering (CSSE) at John University Hopkins. In the platform at the moment you can find a panel with lightweight charts showing the number of infected, deaths and recoveries, by country.
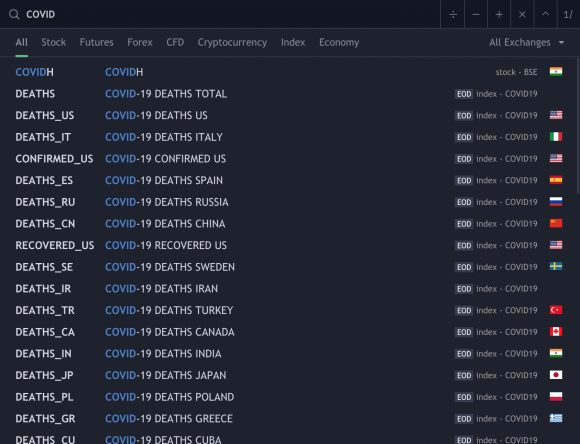
TradingView now also has several tickers for data related to the coronavirus, so you can add both global statistics and statistics for the regions of interest to you directly to the platform and manipulate the display of data as you wish. For example, you can plot the spread of infection in America compared to the S&P 500 index. You can find all the characters associated with COVID-19 by starting to enter COVID19 in the character search bar. These include the number of confirmed cases of the disease, the number of cases of recovery and deaths from coronavirus in each country, as well as around the world. Regardless of whether you want it or not, global pandemics, such as COVID-19, cause panic among people and in markets, and many traders use these “opportunities” to make more money. Go to the TraidingView website and evaluate the impact of the COVID-19 pandemic on the global fabric.


