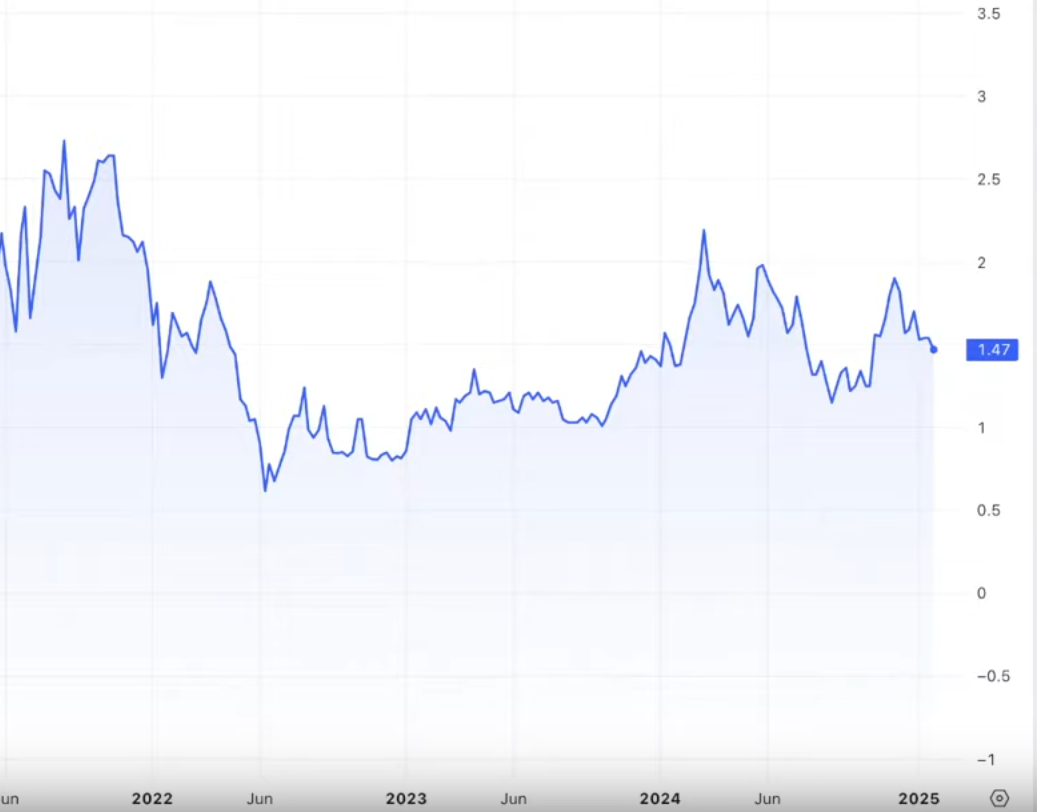
 Today, I’ll share with you a useful market indicator called Market Cap versus Realized Cap (MVRV), which will help you approach long-term cryptocurrency investments more thoughtfully. Previously, we discussed the Fear and Greed Index, but that is more of a short-term indicator for the crypto market. For long-term crypto investments, I’ve used the Hash Ribbons indicator, which last signaled in the summer of 2024 and once again proved reliable, as Bitcoin’s price increased from 60,000 to 100,000 during that period. The MVRV indicator, like Hash Ribbons, is a strong tool for identifying long-term trends, cycles, as well as accumulation and distribution phases.
To fully understand how the MVRV indicator works, it’s important to first grasp the concept of Realized Price.
Realized Price of BTC is the average purchase price of the asset, in this case, Bitcoin. It’s not the current (market) price but rather an average that reflects the typical purchase price. There are several methods to calculate this metric: MVRV Z-score, MVRV Free Float. In simple terms, MVRV aggregates UTXOs (Unspent Transaction Outputs) based on the price of Bitcoin at their last activity. It’s believed that this metric reflects the true value of Bitcoin. Currently, the realized price of BTC is $42,750.
Market Price is the price at which Bitcoin is traded on exchanges and displayed on platforms like CoinMarketCap.
Market Cap versus Realized Cap (MVRV) literally translates to the ratio of Market Capitalization to Realized Capitalization. There are three states of this indicator:
-
MVRV < 1: The market price is lower than the realized price, meaning most investors are at a loss. At this point, Bitcoin’s price is at its lowest, which is considered a good time to buy. The lowest MVRV value for Bitcoin in the last 10 years was 0.63 in 2015. In subsequent years, it hasn’t dropped below 0.78.
-
MVRV = 1: The market price matches the realized price. This is a transitional point, and the decision to buy or sell depends more on market factors. Often, this period marks the accumulation phase by large players.
-
MVRV > 1: The market price of Bitcoin is higher than the realized price. And the higher the value, the more profit investors have and the greater the chance of correction. The highest MVRV value was 4.24 at the end of 2017, when the price peaked at 20,000 USD per 1 BTC. After that, a long recession began. At the next peak of the bitcoin price of 60 thousand in early 2021, the MVRV was equal to 3.7.
Currently, Bitcoin’s market price is $93,000, and the MVRV indicator stands at 2.18.

Looking at the chart, you can clearly see the trend of Bitcoin’s minimum price when MVRV is below 1 and its maximum price when MVRV is at its highest values.
The higher the MVRV value, the stronger the desire among investors to sell their assets and lock in profits, which can trigger a downward trend in the market. Conversely, when MVRV is below 1, the closer it is to 0, the less willing investors are to sell at a loss. Instead, they tend to buy more to average down their positions, aiming to profit earlier in the next bull cycle and, consequently, earn more.
If you expect Bitcoin’s price to rise further this year, you should consider the previous bull market’s MVRV peak of 3.7 as a reference point and start exiting your position if the indicator exceeds 3.
You can check the current realized price of Bitcoin and the MVRV indicator on Chart #1 or Chart #2.
Realized Price and MVRV for Ethereum
For comparison, let’s analyze Ethereum, the second-largest cryptocurrency by market capitalization.
The current MVRV value for Ethereum is 1.5, and its realized price is around $2,100.

You can view the Ethereum MVRV chart via this link.
This suggests that Ethereum, compared to Bitcoin, is in a more stable position, as its market price is not significantly higher than its realized price. Therefore, the potential for further price growth up to an MVRV of 2.5 (like Bitcoin) is much higher, while the downside risk during a long-term bear market would be less severe.
This is the basis for many crypto analysts’ long-term forecasts, without delving too deeply into technical analysis or Elliott Wave theory.
Whether to follow or act on these indicators is up to each investor. However, it’s worth knowing about such tools for analyzing crypto markets and considering them when you’re not entirely confident in your decision regarding the current market situation.


