")
")
")
")
")


![]() In an era where Bitcoin is evolving from a speculative asset into a staple of global portfolios, spot ETF flows serve as an X-ray of institutional intent. Launched in the U.S. in January 2024, these funds aggregate capital from pension funds, endowments, and asset managers - reflecting not impulsive retail buys, but deliberate long-term strategies. This article breaks down how to interpret flow data to uncover hidden market signals, sidestep common pitfalls, and fuse it with on-chain metrics for precise forecasts.
In an era where Bitcoin is evolving from a speculative asset into a staple of global portfolios, spot ETF flows serve as an X-ray of institutional intent. Launched in the U.S. in January 2024, these funds aggregate capital from pension funds, endowments, and asset managers - reflecting not impulsive retail buys, but deliberate long-term strategies. This article breaks down how to interpret flow data to uncover hidden market signals, sidestep common pitfalls, and fuse it with on-chain metrics for precise forecasts.
Flow Mechanics: From Unit Creation to Liquidity Impact
ETF flows capture net capital inflow or outflow. Inflow occurs when investors buy ETF shares: the issuer (e.g., BlackRock or Fidelity) creates new units by purchasing Bitcoin from market makers. Outflow is the reverse: share sales trigger redemption, where Bitcoin is sold on the spot market.
Key indicators:
- Net flows (daily/weekly/cumulative) - a sentiment barometer.
- AUM (assets under management) - scale of institutional footprint.
- Trading volume - short-term activity gauge.
- Premium/discount - gap between ETF price and Bitcoin’s NAV.
Sustained inflows tighten exchange supply, creating scarcity and pushing prices up. Outflows often mask rebalancing or risk-off moves but don’t always cause instant crashes due to hedging.
Fact: On launch day, spot Bitcoin ETFs recorded over $4.6 billion in volume - a Wall Street record.
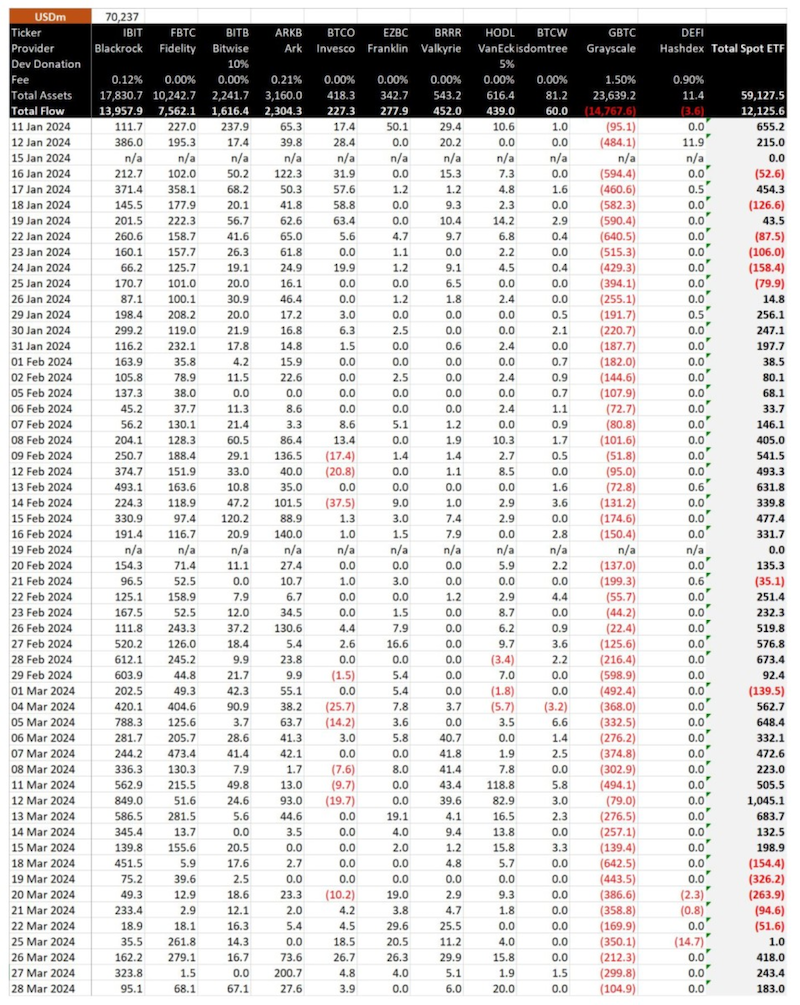
Lags & Correlations: Why Price Trails Flows
Flow-price correlation appears with a delay. From January 11 to March 28, 2024, U.S. ETFs saw $12.13 billion in net inflows, lifting BTC from $46,120 to $71,300 (+54%). Yet market makers (Citadel, Jane Street) hedge with futures, rebalance liquidity, and arbitrage spreads - smoothing immediate impact.
GBTC case study: Conversion to an ETF on January 10, 2024, unlocked capital previously “frozen” by discounts. Within 30 days, $7.4 billion in outflows crashed BTC from $48,969 to $40,127—a classic delayed-pressure example.
Institutional Code: What Consistent Flows Reveal
Stable inflows signal diversification or inflation hedging - hallmarks of sovereign wealth funds and pension giants. Outflows may indicate rotation into altcoins or profit-taking post-rally.
Golden rule: Ignore single-day spikes; focus on 5–7-day trends. Volatility doesn’t scare institutions—sudden reversals foreshadow consolidation.
Data Sources & Multi-Layer Analysis
Real-time tracking:
- Public dashboards: Farside Investors, SoSoValue, BitMEX Research-daily AUM and flow reports.
- On-chain tracking: Custodian addresses (Coinbase Custody) expose real transfers, filtering internal moves.
Integration layers:
- On-chain: MVRV for over/undervaluation, exchange reserves for supply shocks.
- Derivatives: Funding rates & OI for leverage heat.
- Macro: CPI, Fed rate expectations - rebalancing triggers.
AI models already aggregate these layers, spotting patterns faster than humans.
Interpretation Traps
- Myth of direct impact: Inflows often reflect delayed settlements, not fresh capital.
- Liquidity recycling: Funds shifting between ETFs (e.g., GBTC → IBIT) inflate figures without new demand.
Solution: Verify custodian transactions and cumulative trends.
Global Vector: From Hong Kong to the Algorithmic Era
With ETF launches in Hong Kong and London, flows become a cross-border barometer. Market-maker algorithms evolve, turning ETFs into structural drivers, not reactive signals. By 2025, machine learning will fuse flows with on-chain and macro data into predictive models with >70% accuracy over 7–14-day horizons.
Conclusion: Bitcoin ETF flows aren’t noise - they’re the institutional pulse. Master reading them with lags, filter artifacts, and layer multi-dimensional data to gain a tool for forecasting crypto’s medium-term trajectory.
Glossary: Bitcoin ETF Flow Terms (Beginner-Friendly)
- Inflow. Money entering an ETF when shares are bought. Issuer buys BTC to create new units. Ex: +$500M in a day → more BTC leaves exchanges.
- Outflow. Money leaving an ETF when shares are sold. Issuer sells BTC to redeem units. Ex: –$200M → BTC returns to the market.
- Net flow. Inflow minus outflow over a period. Positive = net buying, negative = net selling. Ex: +$300M = net inflow.
- AUM (Assets Under Management). Total value of Bitcoin held by the ETF. Shows institutional scale. Ex: iShares IBIT: $25B AUM.
- Endowments. University, charity, or nonprofit funds investing for the long haul. Ex: Yale Endowment bought BTC via ETF.
- Custodian. Specialized bank or firm storing BTC on behalf of the ETF. Ex: Coinbase Custody, Gemini Custody.
- Custodial transactions. BTC transfers between custodian wallets and exchanges. Visible on-chain → proof of real flow. Ex: 5,000 BTC from exchange → BlackRock custodian.
- Liquidity recycling. Capital “flows” between ETFs but no new money enters. Looks big, price stays flat. Ex: Sell GBTC → buy IBIT.
- Delayed settlements. ETF share trade is recorded, but settlement (T+1/T+2) is pending. Flow shows, BTC not yet bought. Ex: Friday +$1B, BTC purchased Monday.
- MVRV (Market Value to Realized Value). Market price vs. average purchase price of all coins. >1 = overvalued, <1 = undervalued. Ex: MVRV = 2.1 → market “hot”.
- Exchange reserves. BTC held on centralized exchange wallets. Falling → less selling pressure → price up. Ex: Reserves down 100,000 BTC in a month.
- Premium / discount. Gap between ETF share price and actual BTC value inside. Ex: ETF trades 1% above NAV → premium.
- NAV (Net Asset Value). True per-share value if all BTC were divided by shares. Ex: NAV = $62,000, share = $62,300 → 0.5% premium.
- Market maker. Firm (Citadel, Jane Street) that maintains liquidity, hedges, and arbitrages. Ex: Smooths sharp ETF price swings.
- Arbitrage. Profit from price gaps between ETF and spot BTC. Eliminates premium/discount. Ex: ETF +1%, spot 0% → maker sells ETF, buys BTC.
- Hedging. Risk protection: maker opens opposite futures position. Ex: Bought BTC for ETF → shorts CME futures.
- Funding rate. Payment between longs and shorts on perpetual futures. Positive → longs pay → bullish sentiment. Ex: +0.05% → overheating.
- OI (Open Interest). Total open futures contracts. Rising + positive funding → potential squeeze. Ex: OI $15B and growing.
- Spot ETF. Fund that actually owns BTC (not futures). Ex: BlackRock IBIT, Fidelity FBTC.
- Rebalancing. Portfolio reallocation (e.g., 5% BTC → 3%). Appears as outflow. Ex: Pension fund takes profits.